
2024 Q3 Earnings Preview:
Show Me!
STRAIGHT FROM THE TRADING FLOOR
by Michael Reinking, CFA - Sr. Market Strategist
Top Takeaways
- Q3 S&P 500 EPS est. +4.2% YoY, fifth consecutive quarterly increase
- Negative revisions since the end of last quarter slightly higher than historical averages
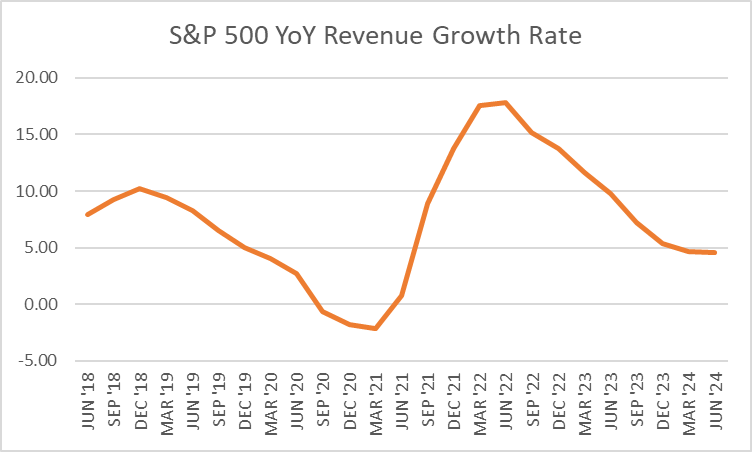
- Revenues est. +4.7%, the 16th consecutive quarterly increase
- Key topics - Economic uncertainty, demand, margins, cost cutting, capex spending and AI impact
- Shareholder return programs hold steady in Q2
What will investors be listening for on Conference Calls?
- Broad Economy
- Have there been noticeable changes to consumer/customer behavior as there are signs that economic activity is moderating?
- Is election uncertainty stifling demand?
- Inflation/Margins
- How are you navigating the balance between previously announced price increases and the impact on volumes?
- Are changes to the current pricing strategy being considered in response to the environment?
- Have efficiency measures helped to preserve margins? Are there additional levers to pull?
- Supply Chain
- How are supply chains and logistics costs being impacted by the situation in the Red Sea, recent port strikes and hurricanes?
- Do you see the recent move higher in logistics costs as a persistent issue?
- Labor
- What are the company’s plans for headcount?
- Has labor availability improved?
- Are wage pressures easing?
- Capital Allocation
- Is the higher cost of capital impacting capex and shareholder return decisions?
- Where is your IT budget focused?
- Financials
- What is the state of the consumer?
- As rates have pulled back has there been an increase in loan demand?
- How will falling yields and a steepening yield curve impact earnings going forward?
- Once we get past the election do you think capital market/investment banking activity will accelerate?
- Are there any signs that credit quality is deteriorating?
- AI
- Is there any slowdown in demand for AI related infrastructure products?
- How much capex is dedicated to building this infrastructure?
- Explain your AI strategy and when you think this will begin to tangibly impact your business.
Setting the Stage - A look back at Q3
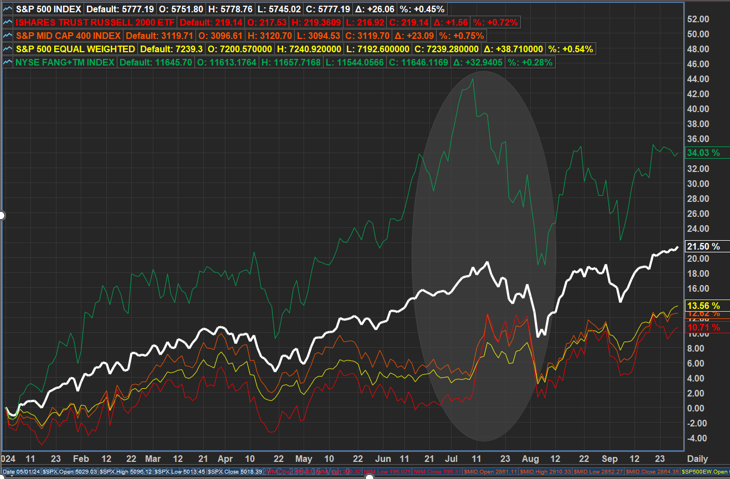
Q2 ended on a mixed note with the S&P 500 continuing to hit new all-time highs ending the quarter up nearly 4%, bringing YTD gains to ~15%. Those gains were becoming increasingly concentrated within mega-cap tech stocks as the NYSE FANG+ index was up 13% and 30% through the first half of the year. Q2 wasn’t as kind to cyclical stocks or down the capitalization scale as the performance gap continued to widen to extreme levels. In Q2 the S&P 500 equal-weight index was down >3% underperforming the market cap weighted index by ~10% YTD. Mid and small cap indices were down a similar amount during the quarter. The underperformance began early in the quarter in response to a move higher in yields, but as yields reversed course during the spring these stocks didn’t benefit as concerns of an economic slowdown began to percolate.
As Q3 began the S&P 500 continued to march to new all-time highs, extending the longest streak since before the financial crisis without a 2% decline in the S&P 500 on a single day. The rally had become increasingly more top-heavy stretching the rubber band even further with the AI optimism driving gains in mega-cap tech stocks. The NYSE FANG+ index was up >8% in the first seven trading days of the quarter. But things changed on the eighth day following a better-than-expected CPI report, increasing expectations that the Federal Reserve would begin its long-awaited easing cycle. Treasury yields moved sharply lower in response to the data as did the USD with Japan’s government intervening adding to the weakness (keep this in the back of your mind). In equity markets this also triggered a violent rotation which saw the Russell 2k outperform the aforementioned NYSE FANG+ index by nearly 20% through the end of July.
This began the unwind of crowded positioning which had been built up given the trending/low volatility environment. The unwind was not limited to equities it was also happening in currencies and derivatives positioning as well. At first the moves were orderly, but you could see strain starting to build beneath the surface with the VIX moving from below 13 into the high teens heading into the end of the month. On the final day of July, the Federal Reserve left rates unchanged as widely expected but clearly set the table for a rate cut at their September meeting while highlighting that it was now shifting its focus back to its dual mandate away from its sole inflation fight.
However, the order really began to break down over the next couple of days. That Thursday there was a round of disappointing economic data adding to the global growth concerns. This was followed by some mega-cap tech earnings that failed to meet the high expectations after the close. Then on the eve of the US jobs report the Bank of Japan surprised markets by hiking rates earlier than expected which caused the Yen to surge adding to the unwind of carry trades sending the Nikkei down >5%. The employment report in the US came in below expectations with the unemployment rate hitting 4.3% amplifying concerns that the Federal Reserve was behind the curve. This was a perfect storm causing the S&P 500 to break key technical levels. The index only closed that Friday down ~2% but the VIX had moved into the high 20’s.
Over the weekend the de-risking continued with the Yen surging causing the worst selloff in the Nikkei since 1987. Circuit breakers were triggered in Korea and Taiwan which both closed down >10%. Crypto currencies also were in free fall with Bitcoin falling 20%. The weakness in Europe and the US was more contained but it was ugly none the less. The S&P 500 traded down ~5% shortly after the open bringing the drawdown from the July high to ~10%. The weakness was most pronounced in the mega-cap tech stocks after Berkshire disclosed it had cut its Apple position and reports that Nvidia had delayed its next gen chip. The NYSE FANG+ was down nearly 10% that morning and 20% from its peak a couple of weeks earlier testing its 200d ma a level that it had consistently held above since 2023. This weakness was enough to bring in the buy the dip crowd. Over the next couple of days markets were choppy as the systematic unwind ran its course, officials in Japan eased concerns of an aggressive tightening campaign, economic data came in better than expected calming the growth concerns and Fed officials made it clear that they were prepared to begin the easing cycle. The S&P 500 had recouped all of Monday’s losses by the end of the week.
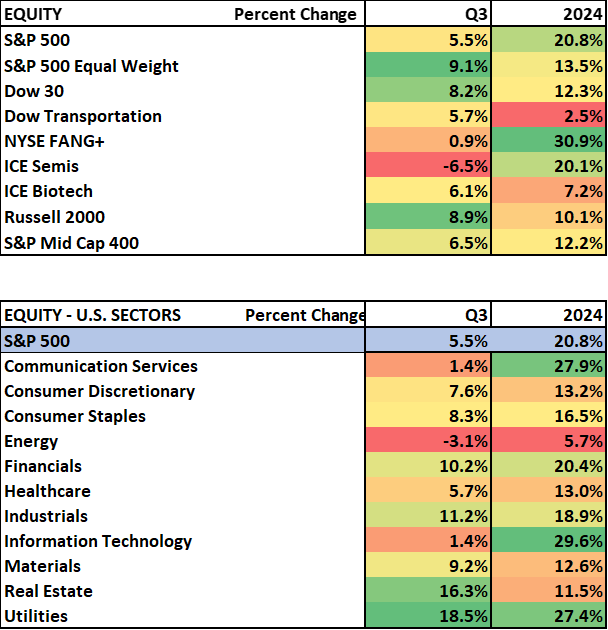
Throughout the remainder of the quarter economic data was not signaling a sharp deterioration in activity, corporate updates were sanguine, and the Federal Reserve aggressively began its easing cycle cutting rates by 50bps. The S&P 500 bucked the seasonally challenging month of September closing higher in 6 of the final 7 weeks of the quarter ending at a new all time high up 5.5% in Q3 and ~21% YTD. The breadth improvement that began at the beginning of the quarter carried through to the end with cyclicals ex-energy and other areas of the market that had underperformed leading to the upside
Inside the Numbers - Data compliments of FactSet Earnings Insight as of October 4, 2024
- Q2 Review
- Q2 S&P 500 earnings +11.4% YoY, fourth consecutive quarterly increase
- 79% of companies beat analyst estimates by an average of 3.6%
- Q2 Revenue +5.3% the 15th consecutive quarter of growth
- Q3 EPS Est. +4.2% YoY
- Sectors with largest YoY growth
- Info Tech (15.2%), Healthcare (10.9%), Communication Services (+10.5%)
- Sectors with largest YoY declines
- Energy (-20.9%), Materials (-2.7%), Financials (-0.4%)
- EPS Est. revisions below historical averages
- Percentage of companies issuing negative guidance slightly below historical averages (60 of 110 negative)
- Revenues Est. 4.7% YoY
- Largest increases: Info Tech (11.8%), Comm. Services (8%), Utilities/Healthcare (6.9%)
- Energy (-2.9%) lone detractor
- Q2 Net Profit Margin Est. 12.1% down from 12.2% last quarter
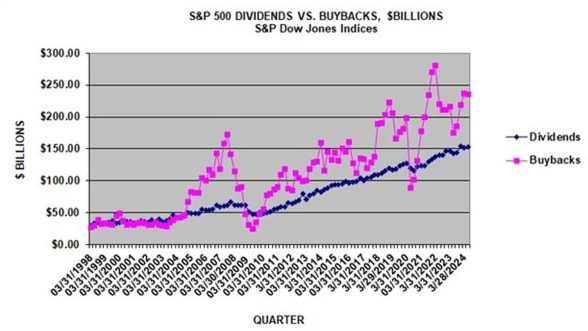
Capital return programs - Data compliments of S&P Global
- Q2 programs were up 0.2% QoQ to $3889.3B
- Q2 buybacks down 0.4% QoQ to $235.9B
- Number of firms carrying out buybacks pulls back from last quarter
- Top 20 companies executed 52.3% of buybacks up from 50.9% in the prior quarter
- Q2 S&P 500 dividends increased 1.2% QoQ to $153.4B from record high in Q4
- New net buyback 1% excise tax impacted Q4 earnings by 0.45%
- Does this move higher down the road?
The Big Picture
Overall, Q2 earnings were solid with the biggest YoY quarterly growth rate since 2022 up 11.4%. As we typically see nearly 80% of companies beat estimates but the average “surprise” moderated from recent quarters at only 3.6%. Coming into the quarter we discussed the bifurcated expectations within the market with the bar set very high for the mega-cap tech names. Those results were strong, with the sector showing >20% YoY growth for the third consecutive quarter but given the high expectations and concerns about AI related capex spending and ultimate payoffs many of these stocks came under pressure. On the flipside, the bar seemed very low for other areas of the market given negative revisions coming into the quarter and the extended period of underperformance. The price action in many of these stocks was quite different where investors used earnings related weakness as an opportunity.
As we approach this reporting season there have been fewer companies negatively pre-announcing but earnings estimates for the quarter have been revised lower by just over 3.5% which is back around historical averages. Consensus estimates are looking for earnings to be up 4.2% a moderation from recent quarters. Q3 tends to be a quieter period, and this quarter is sandwiched between two quarters with >10% growth. This coupled with an increased focus on the macro and the upcoming election might explain why there doesn’t seem to be a lot of buzz coming into the quarter.
During Q3 there has been some moderation in economic activity domestically, but the overall backdrop remains resilient. Globally growth has been more sluggish. Over the last year global companies have pointed to weakness in China demand. The recent actions taken by the government won’t impact Q3, but this could be an inflection point for that economy. According to FactSet China accounts for 7.5% of S&P 500 revenues so this could be a tailwind going forward.
Top line growth has been moderating over the last two years. This will be the 16th consecutive quarter of YoY revenue growth which seems to be settling in between 4.5% - 5% which is a ~2.5% real growth when compared to average PCE during Q3.
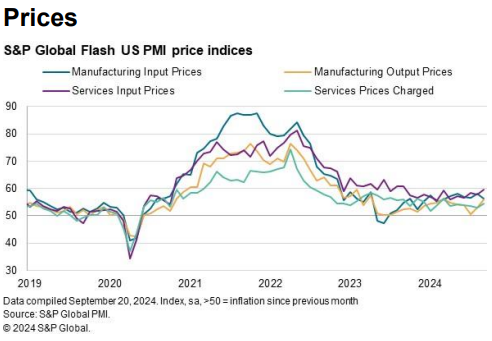
Previous efforts to improve efficiency should continue to support the bottom line. This quarter gross margins are expected to tick down slightly to 12.1% from 12.2% in Q2. There will be challenges to maintaining those margins going forward as revenue growth moderates. Management teams have acknowledged that it is harder to pass on price increases to customers as the prolonged impact of inflation has taken its toll. Last quarter there were multiple companies, particularly within retail, that were cutting prices to drive traffic. We’ll see if this has helped volumes and investors will be listening to see how promotional the holiday season will be. As you can see below input prices increases on the services side have been outpacing prices charged. Within manufacturing that dynamic has been improving but the recent rally in commodity markets could have a negative impact going forward.
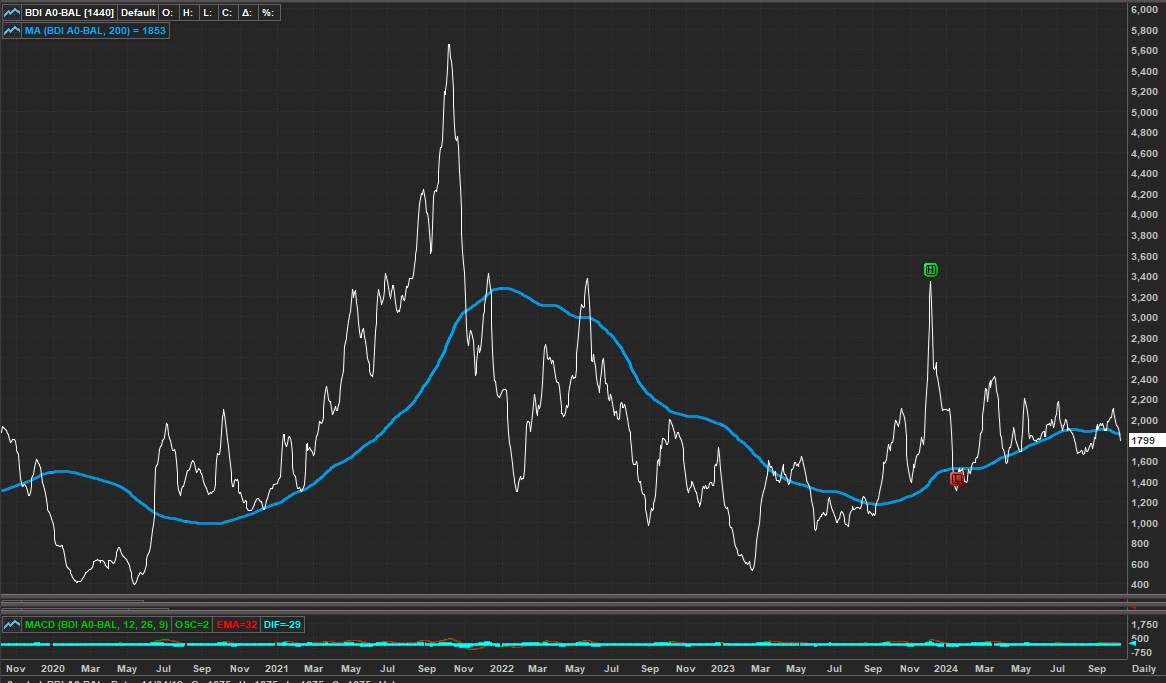
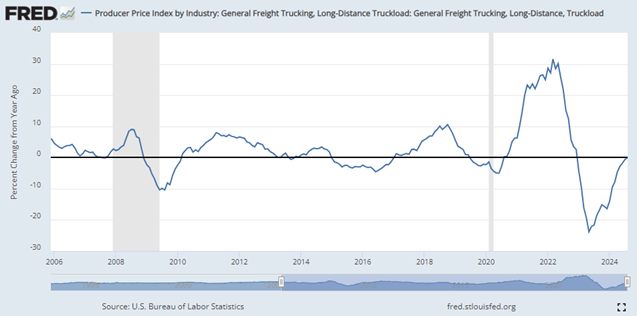
The tailwind from improved supply chains and logistics costs were fading but there are a new set of challenges that are emerging including the situation in the Red Sea, port strikes (which were short lived) and hurricanes. Coming out of the pandemic company supply chains are much more resilient with redundancy and flexibility which should allow them to work through these challenges but there may be some associated costs. See Baltic Dry Index Below.
The higher cost of capital has impacted capital return programs. Total shareholder returns were about flat on a QoQ basis. However, there has been a significant increase over the last twelve months ending in June, up 8% but levels remain well below the 2022 peaks. During Q2 buybacks ticked slightly lower as communication services and healthcare cut expenditures. Increases in info tech and financials largely offset those declines. These two sectors made up nearly 50% of all S&P 500 buybacks. Howard Silverblatt, Senior Index Analyst at S&P, points out that given the rise in stock prices and stock options that have moved into the money that companies are getting less EPS bang for the buck. Dividends increased by 1.2% reversing most of the declines seen in Q1. We have seen some companies pare back using cash flow on shareholder return programs in favor of investing in the business.
Financials will dominate the early part of earnings season and given their unique vantage point of the economy commentary will be closely watched. As the easing cycle is underway investors will be paying close attention to bank sensitivity to declining interest rates and a steepening yield curve. NII/NIM guidance and commentary will likely drive volatility.
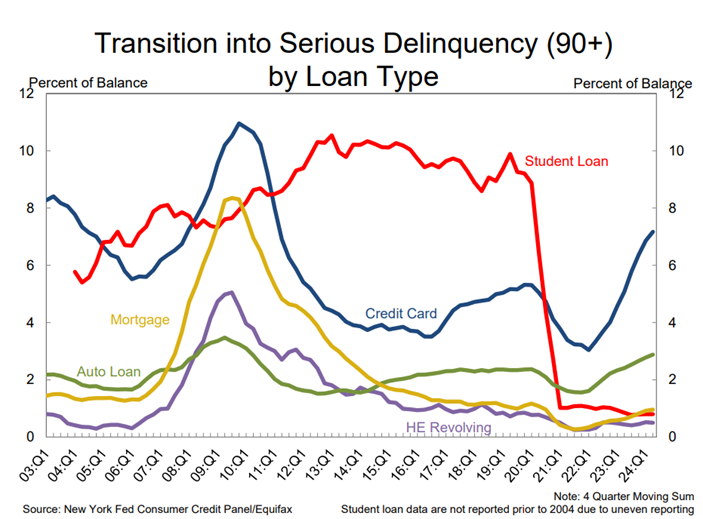
Credit quality is one of the more anticipated aspects of bank earnings. There has been an increase in delinquency rates but much of that is happening within the lower income borrowers. Thus far there have not been signs of that spreading. Outside of consumer credit quality, CRE and C&I will also be focal points particularly for the regional banks. Loan growth outside of credit cards is expected to remain tepid.
Optimism continues to build for capital markets/investment banking activity. A lower interest rate environment should help kickstart M&A activity and the election is around the corner removing some of the regulatory uncertainty. Banks are still waiting on the Basel III final guidelines which will likely hold back increases in capital return programs.
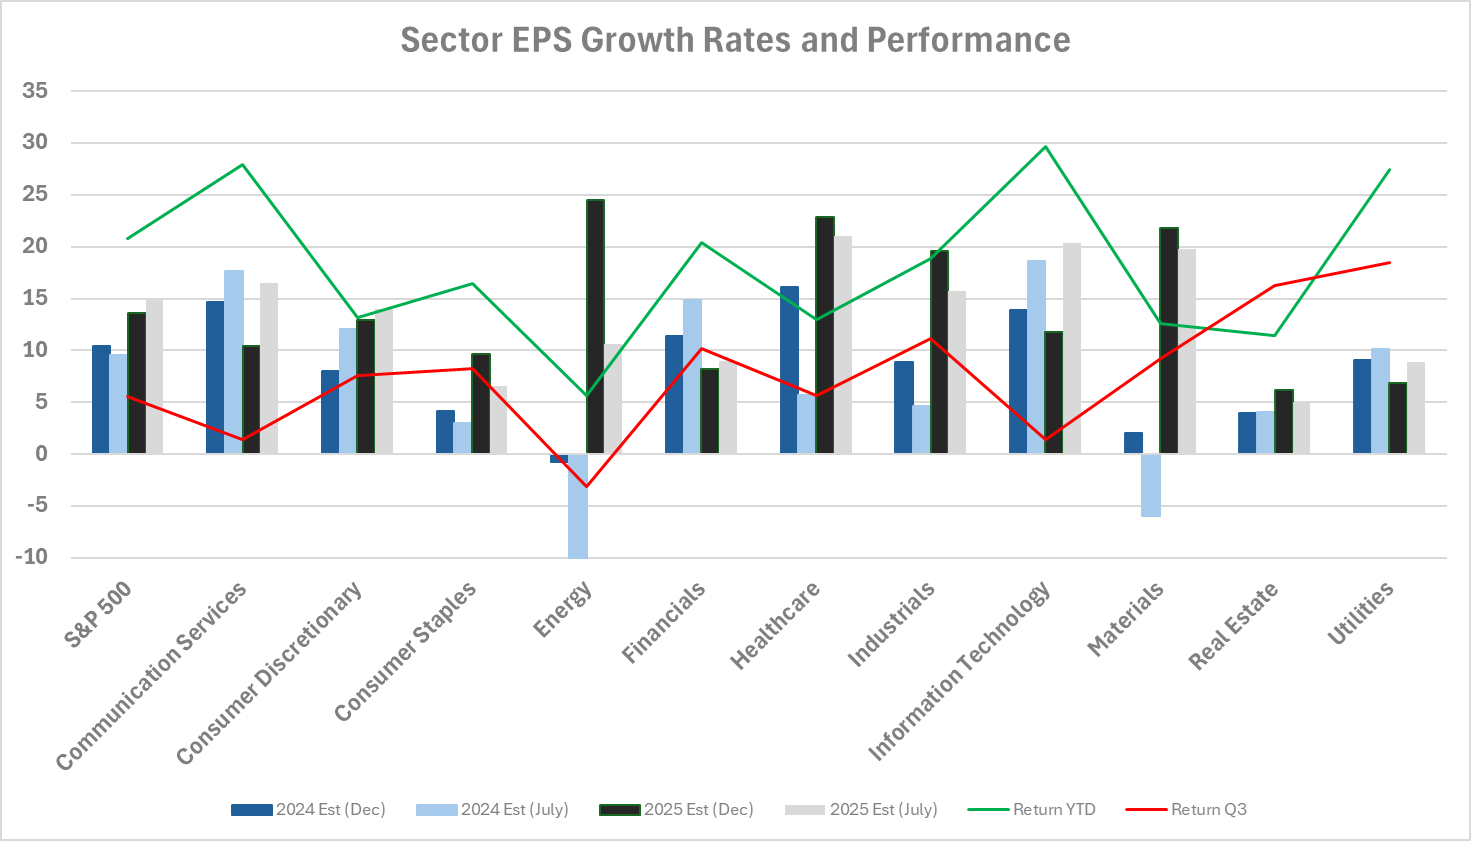
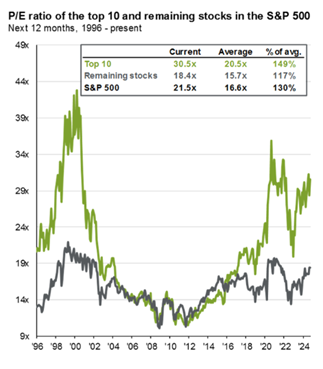
Positive earnings revisions at the start of the year have been a factor in equity market gains. Estimates for 2025 stalled out during the summer and have started to move slightly lower over the last couple months. Those estimates are still calling for ~15% YoY growth which seems to reflect a soft/no landing scenario and capture some of the operational leverage in businesses given the recent focus on cost cutting and efficiency. As equity markets have continued to hit new all-time highs this is causing multiples to expand with the S&P 500 trading at 21.5X. Much of that multiple expansion is happening in the largest stocks with the current multiple of the top 10 stocks at 30.5X while the remainder of the index is trading at a much less stretched 18.4X (see Chart 1 from JP Morgan below).
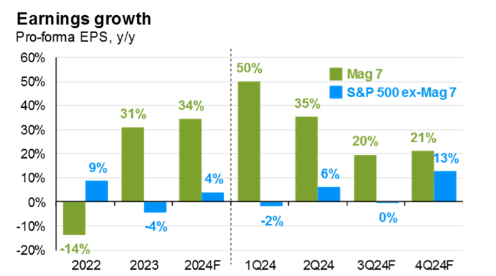
Over the last couple of years, the Mag-7 have been a driver of market performance and earnings growth. Unlike last quarter the expectations for these stocks does not seem to be nearly as euphoric as growth rates are starting to moderate from unsustainable levels. Many of the stocks have traded flat to down over the last quarter. For the record, if earnings continue to grow >10% while the stocks trade sideways they can quickly grow into those valuations. However, the main point here is that going forward that earnings contribution gap is expected to narrow.
After a sustained period of low volatility broadly in financial markets it returned in Q3. I expect that to continue into Q4 as markets have become hypersensitive to incoming economic data, heightened geopolitical risks and of course the election. Despite that lower volatility environment throughout much of the year the response to earnings announcements at the single stock level have been outsized, particularly on the downside, which in part is related to growing options volumes. That is also a trend that I would expect to continue, but what I have noticed is that after the initial outsized move stocks have tended to recoup much of those initial losses over time.
When it comes to earnings season forward guidance always trumps the quarterly numbers but given the uncertain backdrop I think management teams will remain conservative. Investors will be paying even closer attention to conference calls to see if companies are starting to see signs of an inflection point. With the improvement of breadth within the market and expectations for the “other 493” stocks to take the baton it feels like we are at a show me moment. Will it be a Trick or a Treat? Welcome to the fall.
Connect with NYSE
© 2024 Intercontinental Exchange, Inc. All rights reserved. Intercontinental Exchange and ICE are trademarks of Intercontinental Exchange, Inc. or its affiliates. For more information regarding registered trademarks see: intercontinentalexchange.com/terms-of-use