
NYSE MAC Desk
Weekly Recap:
STRAIGHT FROM THE TRADING FLOOR
by MIchael Reinking, CFA & Eric Criscuolo
Published on 7/31/26
DOW 52,485 (+277), S&P 500 7,490 (+52), Russell 2000 2,931 (-15), NYSE FANG+ 17,261 (+288), ICE Brent Crude $90.09/barrel (+$1.06), Gold $4,099/oz (-$2), Bitcoin ~63.0k (-1686)
We came into the week with the S&P 500 having fallen below its 50d moving average the week prior, as hostilities in the Middle East resumed and Brent crude oil prices rose sharply, back over $100. Major US indices hovered around unchanged levels for the first half of last week, but a confluence of earnings updates, oil above $100, and Treasury yields hitting new highs eventually pushed stocks lower. However, despite all the news flow and notable moves from some mega caps (i.e. Alphabet -7% last Thursday) the S&P 500 managed to end last week down a modest 0.6%, and the equal-weight was slightly in the green. We’ve noted here for several weeks the substantial rotation that was occurring under the surface in equities, as AI hardware and Momentum names came under sustained pressure, while areas left out of the AI trade’s massive gains found increasing strength. The dispersion trade has been in full force and kept things afloat.
That activity continued this week. News that China had begun domestic production of high-end chipmaking equipment took names like ASML lower. The latest news of massive circular investments in the AI ecosystem also fanned the flamed lingering concerns about how the industry is funding itself. Reports highlighted Nvidia working on backstopping $750 billion of AI infrastructure deals and financing $350 billion of chip purchases for OpenAI. Then there's the contentious discussions about open-weight and Chinese AI models, and how they could impact that enormous spending that has provided such a boost to the chip and infrastructure names.
The Tech Wreck was still in effect, but other areas continued to hold up as we moved through the week. The ICE Semis Index was down over 10% through Wednesday, however the S&P 500 was only down about 4% from its all time closing high, even with a sharp drop on Wednesday post-FOMC (getting to that). The equal-weight version of the S&P 500 closed at an all-time high on Tuesday. All this despite stocks like former trillion dollar market cap Micron down 40% from its highs.
Wednesday brought the big market event we were waiting for- the Federal Reserve’s rate decision. The Fed kept rates unchanged, in line with the consensus call. However, long-term yields jumped and stocks sold off as Warsh's press conference left a lot of questions unanswered, which seemed to be on purpose. With rates rocketing higher, the S&P turned sharply lower in the final hour of trade, falling 130pts from the day’s high and ending down 1.5% as semiconductor and memory chip stocks got clocked again, though they weren’t alone.
With the the Fed meeting done and dusted, the PCE data and initial 2Q GDP were supposed to be the closing highlights of the week, outside of earnings. But that was before we had A Situation.

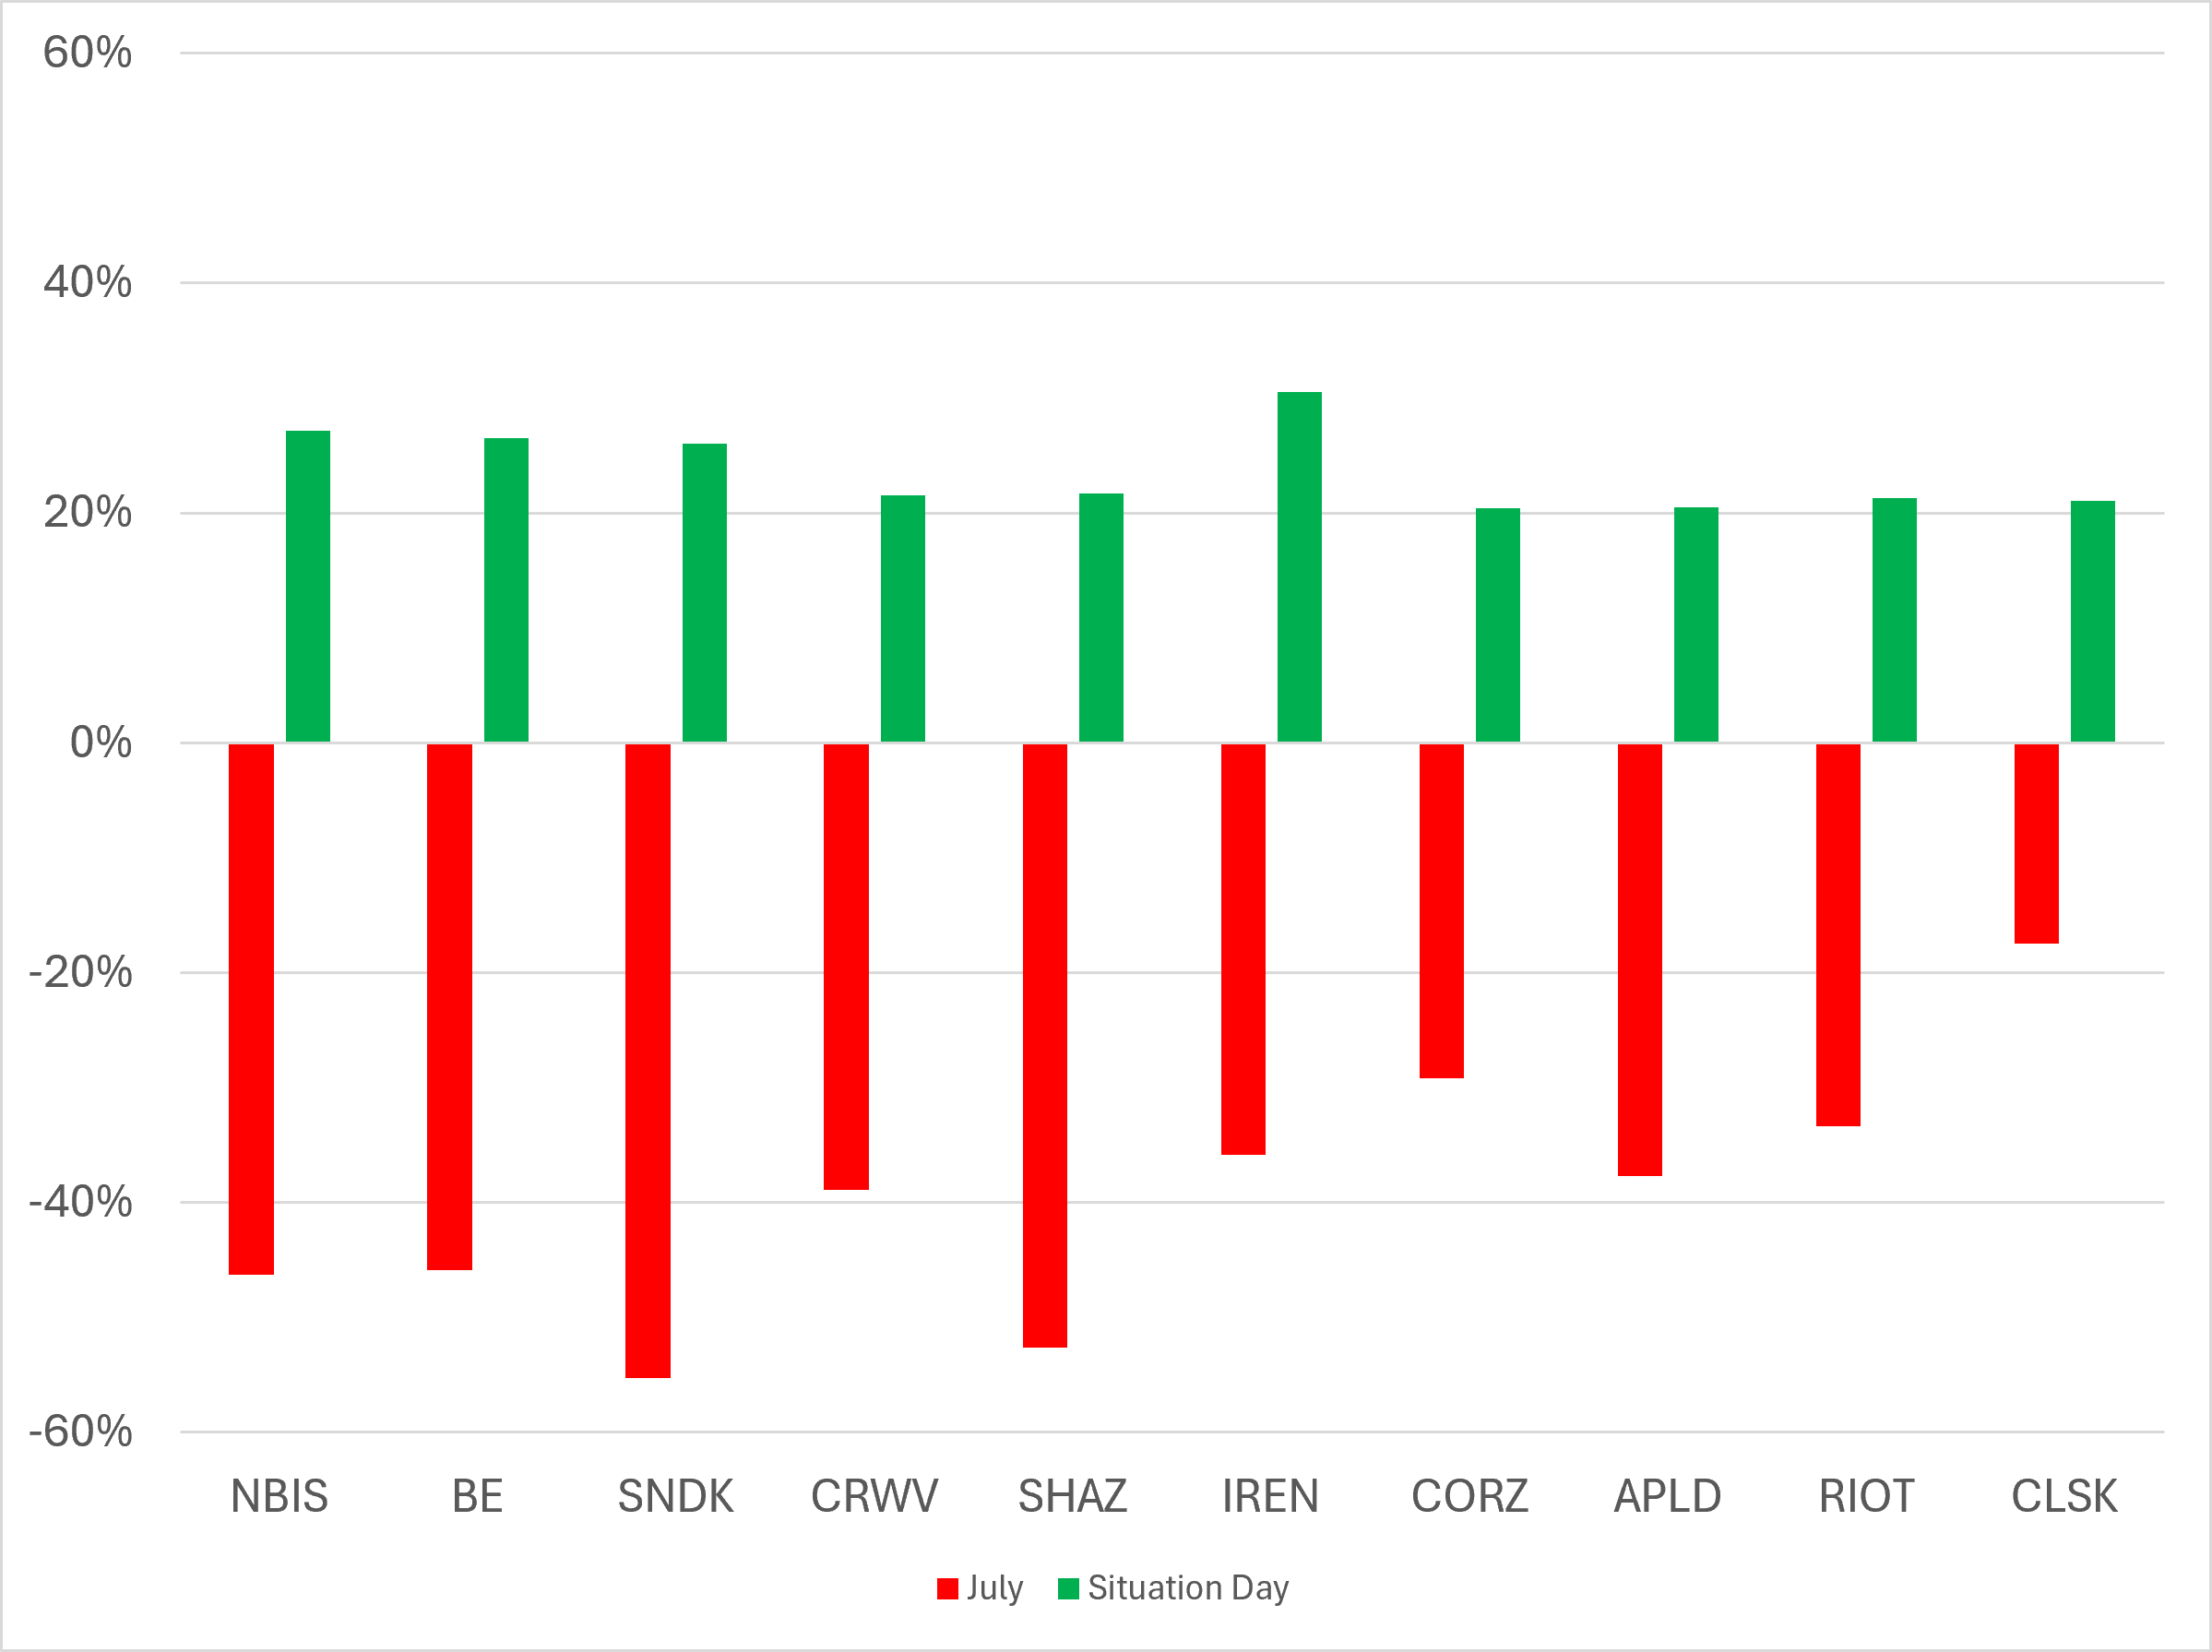
CNBC and others began reporting that hedge fund Situational Awareness was liquidating its public stock holdings due to substantial losses over the past month. The fund and its 24 year-old founder Leopold Aschenbrenner, formerly at OpenAI, rose to fame due to its concentrated bets on AI that drove incredible returns. The FT reported that the fund had been up 439% on a net basis through June. As those concentrated bets began to stumble from the rotation out of AI (which hit its stride at last month-end) the fund was forced to start selling holdings as leverage began to pile onto the drawdown and margin calls began. The dam finally broke. Situational’s situation has brought unwelcome flashbacks to the Archegos fund blowup a few years ago. To what degree the fund's forced selling contributed to the tech decline is hard to say, but it likely played a role in at least the last part of this move lower. It's also likely that trading desks were well aware of the potential issues and became more aggressive.
While the potential for similar blowups at other funds is lurking, this could also serve as a clearing event, as tech has repriced lower and the removal of forced selling allows funds to reload their AI plays and unwind the rotation into those other areas we have talked about. It played out like that the day the the news broke. The ICE Semiconductor index rose 9%, and DRAM memory ETF rocketed 17%, while the Healthcare and Consumer Staples sectors- two of the anti-AI areas- fell ~2%. Looking at the dramatic reversal of Situational's Top 10 holdings from July's puke to Thursday's performance shows how much pressure was relieved, at least for a day. Most of the these stocks have given back some of those gains on Friday but the declines were low-single digits.
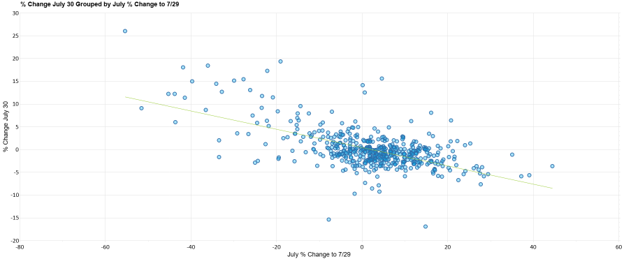
Another view of the broader market shows the snapback on Thursday in the stocks most under pressure in July versus the better performing stocks in July flat to lower.
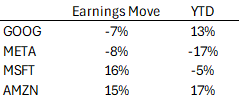
Beyond the market struggling to come to grips with the Fed's new sheriff and hedge fund blowups tossing around stocks, earnings continued to flow in the background. Hyperscalers were front and center this week and we saw a big divergence among them. Last week Alphabet sold off sharply despite Cloud revenue exploding 82%, as margins missed and full-year capex guide was raised again to $195-205B, from $180-190B. This week it was Meta's turn to get whacked on its earnings. The ad business performed well but management pushed back on the idea of Meta selling excess compute to outside customers- it may happen but it wont be a core strategy. Microsoft and Amazon were the hyperscale winners this week as both ripped higher post-earnings. Microsoft came in as a laggard and put up solid numbers as did Amazon, with big growth in AWS and very optimistic commentary on their in-house silicone. The price action this week showed considerable skepticim around Meta's AI strategy, while Amazon ripped higher despite free cash flow going $9 billion in the hole. Apple joined Meta in falling out of bed post-earnings. They have taken a decidedly different route than others, expanding relatively nothing on capex so the concern isn't cash incineration, just ho-hum results after a ~20% gain on the year, along with long-time CEO Tim Cook (aka Tim Apple) stepping down.
There's much more to the market then hyperscalers, and overall earnings continue to be healthy, if not impressive. That has provided support for the market as the sub-surface currents swirl and slosh from one group of stocks to another. According to FactSet, 86% of S&P 500 reporters have beat EPS estimates, and 77% have beat on sales, both above their 5 and 10-year averages.
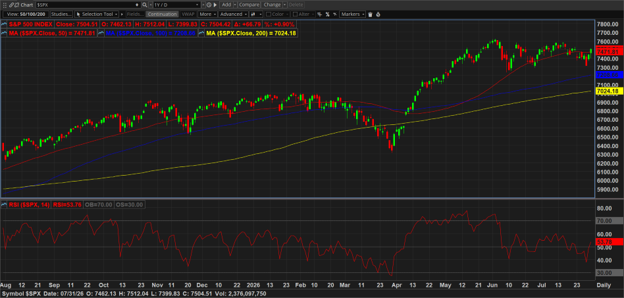
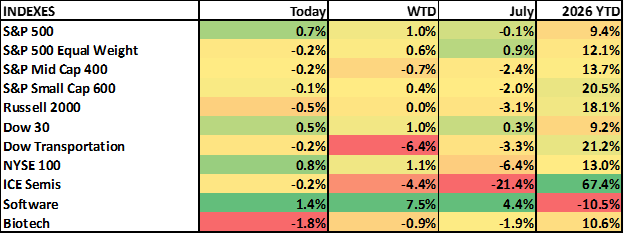
With all the crazy moves, the S&P is up 1% this week and the equal-weight is up as well. Small caps lagged but were flat to slightly higher. The Dow Transports was big under-performer with CHRW down 20% after earnings. The S&P gains pushed it back above the 50d ma and just below 7500- it was there before fading a little at the close.
Despite the Jordan-like Situation bounce, the ICE Semis index fell 4% this week, highlighting the carnage surrounding the group. Sandisk ripped 26% on Thursday and finished the week down 13%. On the other hand, software pulled out of its stall last week and the IGV ETF rose 7%.
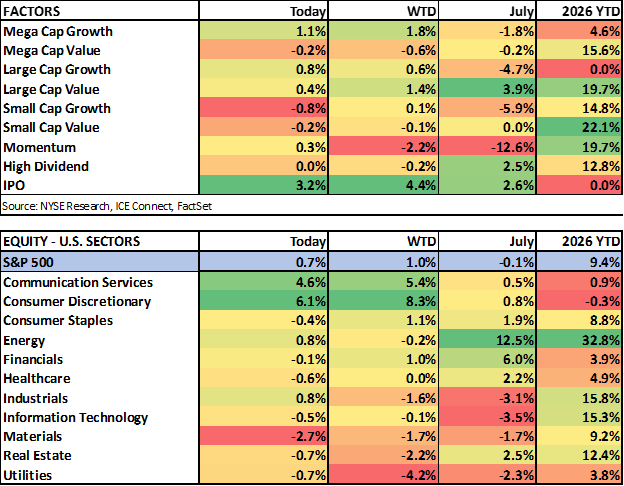
Sector-wise it was Discretionary smoking the other 10. That was mostly from Amazon's 17% gain but most retail and leisure stocks were also strong. Comm Services put in a very strong week as well, led by Alphabet's 11% gain. Several sectors were flat to modestly higher this week. Utilities led to the downside as rates moved sharply higher. That also hit Real Estate. Materials also underperformed as negative earnings reactions to Corteva and Linde on Friday weighed on the sector. Housing-related stocks also fell.
We're also wrapping up July today. It's fitting that with all the bonkers moves across the market, the S&P 500 is.......basically flat. The equal-weight is up 1%. Small caps lagged and the rise in treasury yields likely weighed on the group as whole and they were outperforming coming into the month.
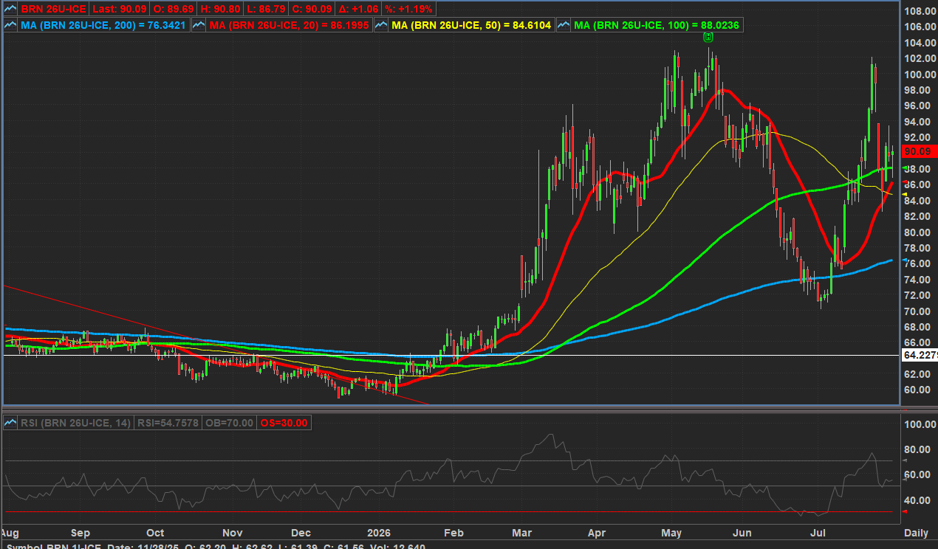
Energy was the leading sector in July. Brent crude was up over 20% but took a wild ride, rising from $73 to $102 before pulling back to $90. Financials and Healthcare, two sectors we have noted as beneficiaries of the tech unwind (and rate move for financials), were also near the top of the board. Tech and Industrials led to the downside. We've written far more about Tech than we've ever wanted to. Industrials were also caught up in the Tech weakness, since they are building and powering the data centers. Housing-related stocks also came under pressure (and Homebuilders were down about 10%).
Economic Data and the Fed:
This week was much more about earnings and the Fed as opposed to economic data but that will come back into focus next week. After a big decline in May, headline durable goods orders bounced back modestly but missed estimates with computer and electronics products up 3.1%. Closely watched Capital Goods (ex-defense and aircraft), a proxy for business investment rose 0.9%, slightly above estimates though down from last month’s 1.9% increase. The Conference Board’s Consumer Confidence remained subdued, slipping from last month and coming in slightly lower than expected.
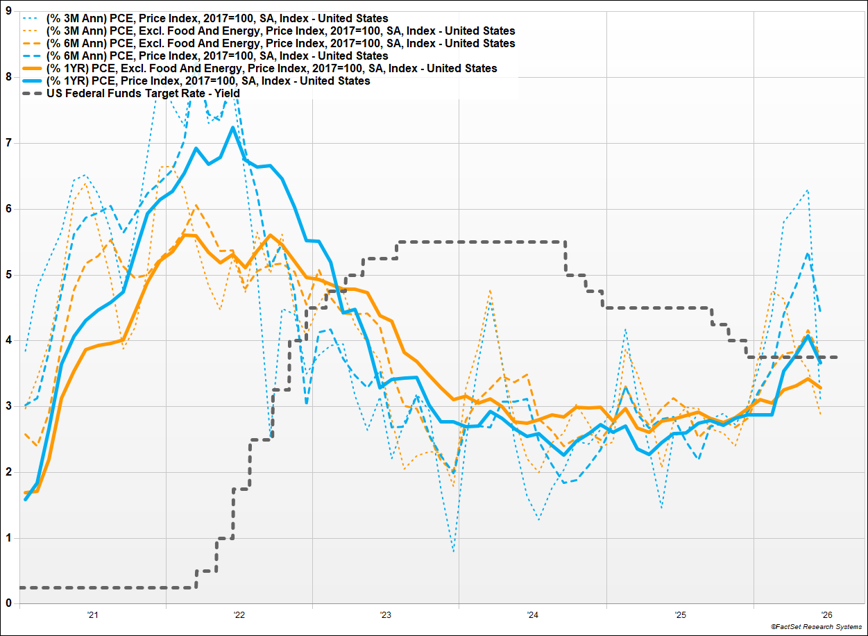
The week’s main economic data came on Thursday after the Fed meeting, highlighted by the inflation data. Headline June PCE fell 0.1% m.m, as expected, and down from last month’s 0.5%. Core rose 0.1% a tick below the 0.2% consensus and also down from last month’s 0.3% growth. This is another coolish inflation print following the last CPI and PPI prints and added credence to the Fed’s decision to keep rates unchanged.
Q2 GDP rose 1.5%, below estimates and last month’s 2.1%. Higher imports were the main drag, pulling GDP down over 1%, while Consumer Spending was strong, growing 3.2% (up from 0.5% last quarter) and contributing 2.0% to the overall growth (so, more than the total 1.5% growth). Non-residential equipment fixed-investment rose 15.2%, only slightly lower than last quarter’s 15.8%. Residential fixed investment rose 1.5%, turning positive after five straight quarters of decline. Personal Income rose 0.2%, slightly below consensus while Personal Spending was inline at 0.3%. Jobless claims remain at subdued levels.
Moving to the Federal Reserve, despite calls for a rate hike getting louder in the days leading up to the meeting, rates were left unchanged. After the unanimous decision in Warsh’s first meeting there were three dissenters who preferred a hike (Kashkari/Hammack/Logan). The dissenting triad defended their position today effectively saying that they preferred a hike now to prevent more aggressive action down the road should inflation get more entrenched.
During his press conference Warsh implied that the market tightening of financial conditions inter-meeting (see real yields below), which he credited to the lack of forward guidance, was doing some of the Fed’s job for them. The initial market read was dovish with yields, particularly the 2yr, moving lower (partially positioning-related) and equities rallying. However, 10 and 30y yields started to move higher during Q&A, when reporters began to zero-in on the inflation framework and “what are you waiting for” to hike rates. He didn’t provide any clarity and at times the statements seemed to be contradictory, leaving markets to price in additional uncertainty.
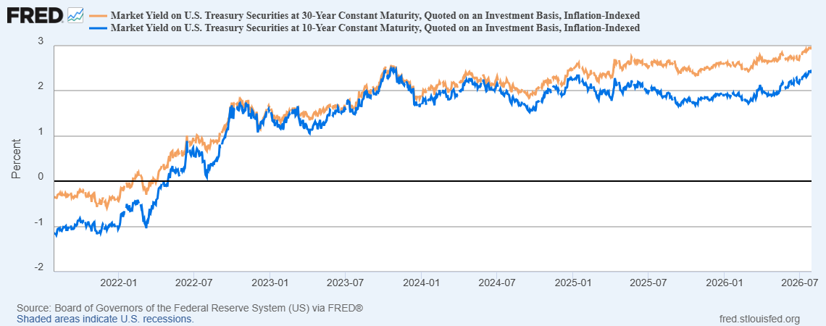
Since the Fed meeting there has been a steepening of the yield curve but today rates have moved up across the curve. The long end is hitting new YTD highs with the 30yr yield at the highest level since 2007. Bond volatility is starting to move higher which is something to keep an eye on.

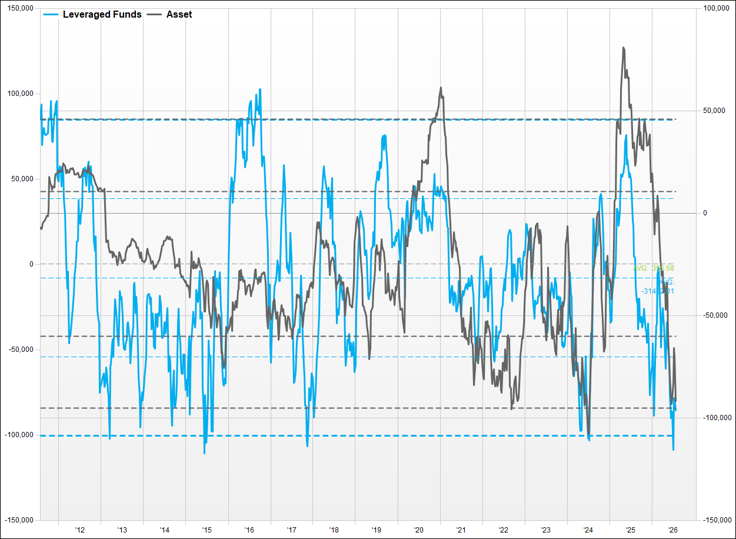
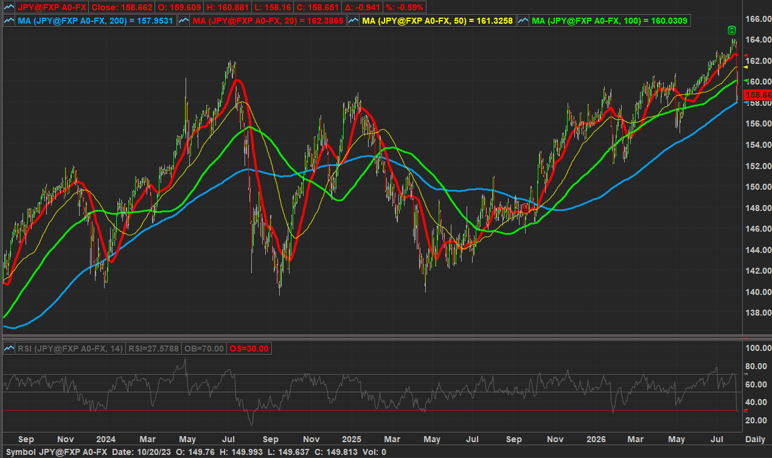
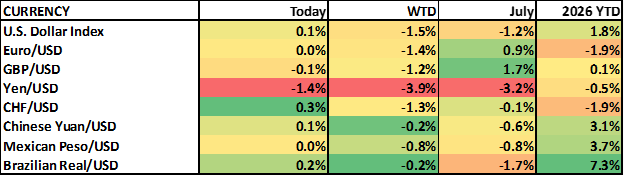
Moving to currencies…..Japanese officials confirmed they intervened in the FX market yesterday, driving the substantial mid-day strengthening against the Dollar. The Treasury reportedly conducted a rate check (one-two, one-two) as well, which would suggest a coordinated response. Bessent also commented yesterday that the yen is “very undervalued”. Reports put the expenditure up to $50 billion. Intervention in the South Korean won is also highly suspected. The Dollar has strengthened again today after Reuters reported that the Treasury told a number of banks to "stand ready for future action". Overnight the BOJ held rates as expected. As you can see below Yen short positioning had gotten pretty extreme again.
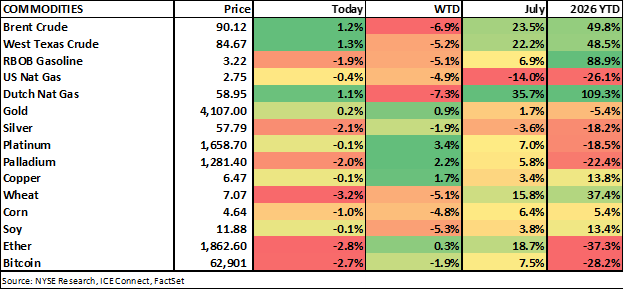
Commodities and Crypto - Mostly higher for the month but pulled back this week
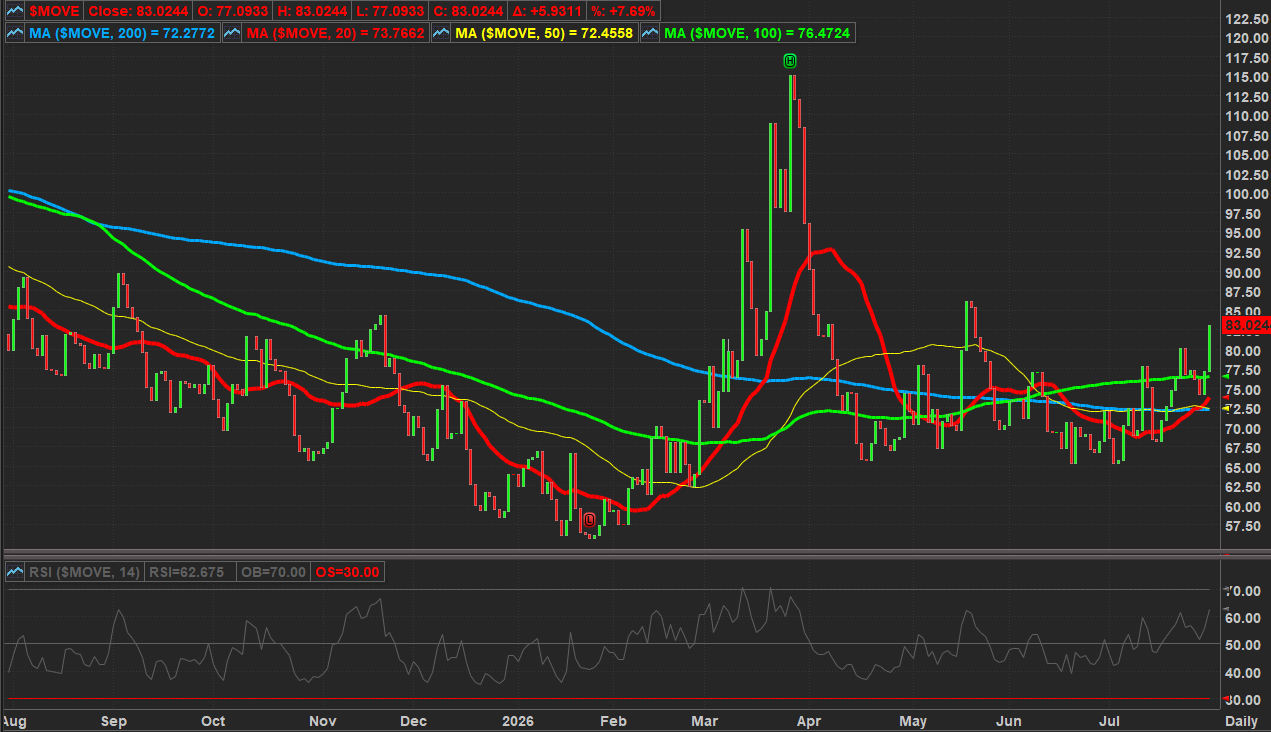
- Energy - Oil prices pulled back to start the week after the administration paused attacks over the weekend. However, Iran broke the peace and the US has stepped up strikes with President Trump repeatedly saying we will “hit ‘em hard”. After breaking above $100 last week prices pulled back into the mid-80’s testing the 50d and rising 20d ma’s before bouncing back to ~$90. There was a 7ml barrel draw after last week’s surprising build. SPR inventories hit the lowest levels since the mid 1980’s after another 3.7ml barrel draw.
- Natural Gas - prices in both the US and Europe ended the week lower. However tere was a big divergence between the two regions for the month with prices in Europe moving sharply higher as it is directly impacted by the closure of the Strait, and after a Russian drone attack on a Ukrainian gas facility earlier this month.
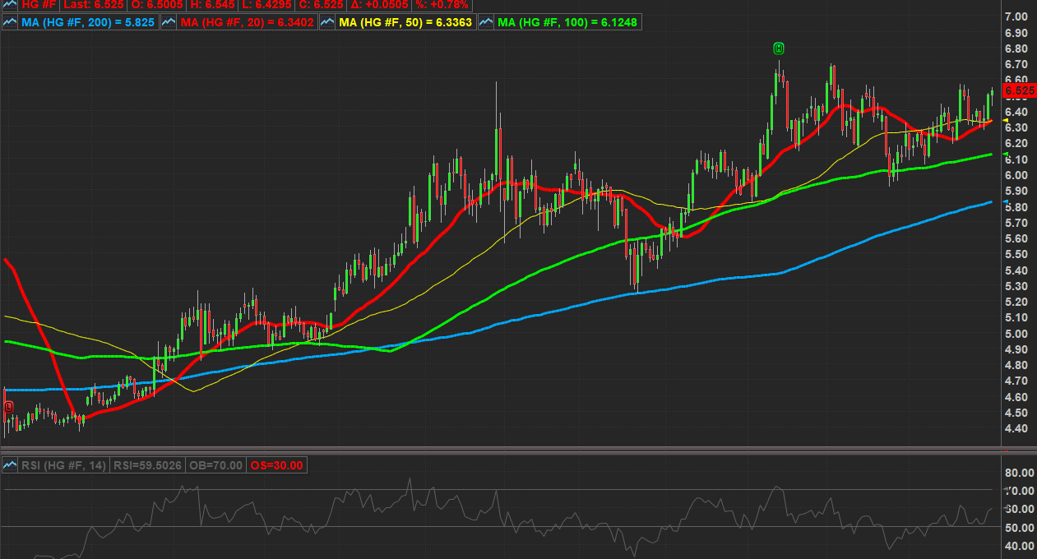
- Metals - mostly higher this week and month though the complex continues to be in a consolidation phase after the blowoff move earlier this year. Copper has been a different story holding near YTD highs with supply constraints amidst strong demand for data centers and electrification.
- Ag - prices moved lower this week after moving higher throughout the month.
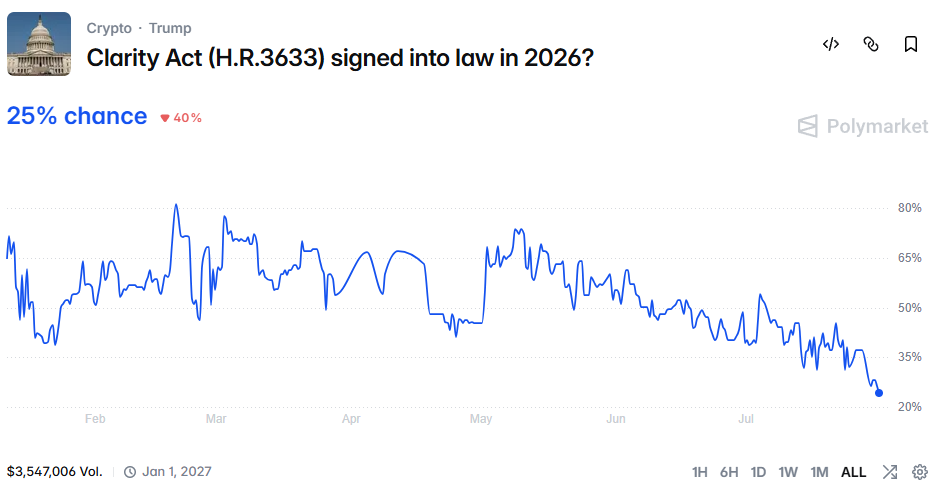
- Crypto - The complex pulled back this week after bouncing throughout this month. Hope for the Clarity Act is fading despite more support from large financial institutions. Democrats have sent a counterproposal to the administration related to ethics provisions. There has not been a response from the administration yet. 7 Democratic votes are needed to get the bill across the finish line and the clock is running out before the summer recess. Odds of passage by the end of 2026 on Polymarket have fallen to 25%. Overnight there was a hack which captured around 600 Bitcoin in 25 minutes from single signature Coldcard wallets after an attack exploited a firmware update which added to today’s weakness.
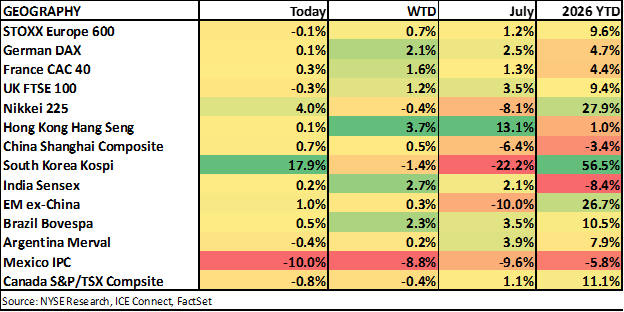
Global Equities - For tech heavy indices in Asia they pretty much followed the path of the momentum unwind and the Situational Awareness saga described above for the week and month. European indices ended modestly higher being somewhat insulated from the situation
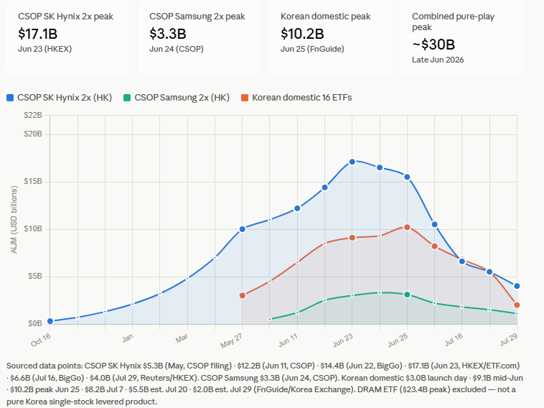
South Korea - The wild ride has continued with multiple circuit breakers and a massive rally to end the week. The memory earnings highlighted the very significant growth with both Samsung and SK Hynix pointing to the long runway for demand. SK Hynix missed the sky high street expectations. As we’ve discussed levered ETFs were a big driver of the parabolic move to the upside earlier this year. Below is a rough chart looking at levered ETFs tied to this market. Keep in mind this does not include DRAM, in which Hynix and Samsung are large holdings. Throughout the month regulators have taken action to try and stabilize markets- increasing deposit requirements, limiting retail ownership of levered ETF’s to 20% of total investment portfolio and considering only allowing institutional investors to trade these products. Here are some staggering stats from Goldman in the middle of the month, which doesn’t even include this week’s volatility, “Goldman Sachs estimated that 1.2 million leveraged accounts had received margin calls by July 13 — equivalent to roughly one in every 30 adults in the entire country facing a blowup risk. Of those, 320,000–360,000 were fully liquidated.” This suggests that positioning like the US should be a bit cleaner going forward.
Japan - after last night’s rally the Nikkei ended the week about flat but was down 8% for the month. The losses were very concentrated in tech (Kioxia down ~50%, Tokyo Electron -30) while there were broad-based gains across the rest of the index. Currency and bond weakness has been the big story for most of the month before the recent intervention discussed above.
China/Hong Kong - Economic data has continued to disappoint. Nothing too notable has come out of the Politburo. Memory maker CXMT rocketed up 466% on its first day of trading. Earlier this week the Trump administration banned imports of new Chinese robots and power inverters. It was another strong week for the Hang Seng which ended the month up >10%. Financials have performed well as have the internet companies. Moonshot’s Kimi K3 open source AI model burst onto the scene with the company reportedly raising $3.5B at a $35B valuation. The Shanghai Composite ended the month lower with chip companies doing most of the damage despite the focus on self-sufficiency and reports early this week that China had begun domestically manufacturing DUV machines (deep ultraviolet lithography), which would be delivered to local chipmakers by the end of the year.
Europe - Most major indices ended the week and month modestly higher. Like the US it was a busy week of earnings which were generally positive. Yields moved higher after a slightly hotter than expected inflation print this morning.
UK - The BoE also left rates unchanged this week with a 6-3 vote like the US though expectations for a rate hike in September have moderated.
What's on Tap Next Week
Earnings will continue at a brisk pace and include Caterpillar, McDonalds, Lilly, Disney, AMD, and SpaceX’s first earnings as a public company. The labor market will be under the spotlight with Monthly payrolls on Friday. ISM Manufacturing and Services will also be important reports. And speaking of Jersey Mike’s I'll be heading to the Jersey Shore for a little vacation. If I see the real Situation I am definitely showing him this note. You’ll be in good hands with the other famous Jersey Mike, my colleague Michael Reinking. Enjoy your weekend.
Calendar
- Weekend - OPEC+ meeting
- Monday -
- Earnings Pre-Market: ALX, AVA, CMDB, CNA, CNH, DEA, HESM, KOS, L, MAR, PLOW, SBH, TSN
- Economic Data:
- US: ISM Manufacturing, S&P final Manufacturing PMI, Construction Spending
- Global: China Rating Dog Manufacturing PMI, South Korea Manufacturing PMI, Germany Retail Sales, European final Manufacturing PMIs
- Agriculture: Weekly crop report
- Central Banks: Fed Senior Loan Officer Opinion Survey (SLOOS)
- Treasury: Refunding Estimate
- Auctions: US 3/6mo
- Earnings After-Market: AHRT, ALG, ARE, ALSN, AMRC, AESI, BSM, BCC, BRCC, BWXT, CBT, CSR, CLX, CRD.B, CRGY, CTOS, DAC, EC, GPOR, IBTA, IRT, IIPR, INVX, INSP, IVT, JBTM, JELD, MATX, MED, MTUS, NJR, OKE, ON, OPAD, PAY, PGR, PLTR, POWL, SBAC, SNAP, TTI, TDW, TKO, TGS, UTL, VVX, VTS, VNO, VOYG, WHR, WMB
- Tuesday -
- Earnings Pre-Market: ACRE, ADM, AIN, AME, AOMR, APO, APTV, ATKR, BALL, BOW, BR, BRBR, BRSL, BXDC, CAT, CLDT, CMI, CTRI, DD, DOCN, DUK, ENR, ET, EVEX, EXPD, FIS, HSBC, GPK, GWW, HVT, INGR, IT, KIM, KNF, LDOS, MCD, MD, MPC, MPLX, MRK, MRP, NPO, NRG, NXRT, OPLN, PEG, PFE, PNW, PRKS, Q, ROK, RVTY, SMP, SPOT, SQNS, STVN, SUN, SYY, TDG, TKR, TPB, TREX, ULS, USAC, W, WAT, WLK, WLKP
- Economic data:
- US: LMI Logistics Survey, Trade Balance, JOLTS, Factory Orders, Economic Optimism
- Global: South Korea inflation, Italy Retail Sales, Canada Trade Balance
- Auctions: US 6w/52w
- Energy: API Crude Inventories (AMC)
- Earnings After-Market: ACEL, AFG, AIZ, ALAB, ALIT, AMD, AMGN, AMWL, ANET, ANGX, ARDT, AROC, BBBY, BIO, BKNG, BV, BXC, CALY, CC, CE, CHCT, COMP.EQ, CPNG, CRBG, DBRG, DEI, DOC, DVA, DVN, ECG, ECO, EMR, EOG, EQH, EVTC, FBIN, FOA, FTK, GIC, GILD, GXO, HL, HNGE, HY, IFF, IPI, ITUB, J, JAN, JBGS, JXN, KAI, KODK, LDI, LRN, LACC, LUMN, MAC, MBC, MEC, MNTN, MOS, NGL, NVGS, NXDR, OGS, PACS, PARR, PINS, PRIM, PRU, PSTL, RBA, RVLV, RYAM, SGHC, SKT, SKY, SPCX, TALO, TBI, TDC, TOST, TSLX, TX, UP, USNA, VOYA, VTOL, WK, WTRG, WTTR, ZETA
- Wednesday -
- Earnings Pre-Market: ADNT, AMPX, BWA, BCO, BAM, CDW, CPRI, CG, COR, CRL, CIM, CHH, CRCL, YOU, LAW, CWK, CVS, DKL, DK, DIN, DIS, LPG, DT, ECVT, EPC, ELAN, FLUT, FUBO, Glencore, GLXY, GPN, GFF, GFS, HGTY, HLLY, HPP, Infineon, IRM, KMT, KD, LCII, LLY, LPX, MTRN, MFA, NRP, NATL, NYT, NI, NWN, OC, PSBD, PRGO, PSX, PRMB, RRX, RPC, SHAK, Siemens Energy, SHOP, SN, SMRT, SWX, SR, TRIN, UBER, UTZ, VVV, VSH, VPG, VYX, ZBH
- Economic data:
- U.S: ADP employment, ISM Services, S&P final Services PMI, Mortgage Apps
- Global: China RatingDog Services PMI, France Industrial Production, Europe final Services PMIs
- Central Banks:
- Rate Decision: India, Brazil (AMC)
- BOJ minutes
- Speakers: Fed Cook
- Energy: EIA Inventories
- Treasury: Refunding Announcement
- Auctions: 17w
- Earnings After-Market: ACA, AGBK, AGL, AKA, ALB, ALL, APLE, ATEN, ATO, AWR, AXIA, BBDC, BGSF, BHR, BKH, BROS, CACI, CAPL, CDE, CDRE, CF, CMP, COOK, CPA, CPAY, CPS, CSV, CW, CWEN, CXT, CXW, DASH, DHT, DHX, DLX, EBS, EE, EHC, ELF, ETSY, EXPE, FG, FIG, FNF, GNK, GNL, GNW, GPMT, HBB, HCC, HHH, HLF, HMN, HP, HRTG, HUBS, INN, IONQ, JOBY, KMPR, KNTK, KRO, KVYO, LB, LEU, LTC, MATV, MCK, MET, MGY, MIAX, MLR, MSI, MTDR, MUR, MUSA, MWA, NC, NEXA, NL, NVST, O, OBDC, OEC, ONT, ORA, OTF, OUT, OXY, PAYC, PRI, PRSU, QGEN, RAMP, RCUS, RDN, RDW, RIG, RYN, SEG, SEI, SGU, SM, SMA, SMR, SNDK, SOLV, SRI, SST, STE, TNC, TPC, TPL, TPVG, TROX, TS, UGI, UHAL, UMH, USPH, UTI, UVV, VAL, VEL, WBI, WDC, WES, WTI, WTS, XPER, XRN, XYZ, ZIP, ZVIA
- Thursday -
- Earnings Pre-Market: ASPN, ATI, AVNT, BDX, BKSY, BKV, BOBS, BXSL, CARS, CEG, CHGG, CION, CNR, COLD, COP, DAN, DCO, DDOG, DNOW, ENOV, EPAM, ESAB, EVH, FOUR, FISV, FSK, FUN, FVR, GEL, GENI, GEO, GHM, GNE, GOLF, GSL, HAE, HWM, IBP, ITGR, ITT, KOP, KVUE, LCLN, LEG, LNG, LOAR, MAGN, MDU, MMI, MMS, NCDL, NREF, NUVB, ONIT, OPTU, OSCR, PH, PLNT, PR, QSR, RL, RXO, SDHC, SGI, SHO, SPH, SRE, SSTK, STWD, TAP, TDAY, TFX, TGLS, TIC, TRC, TRGP, TSQ, U, USFD, UWMC, VAC, VIA, VNT, WD, WMS, WRBY, ZTS
- Economic data
- US: Challenger job cuts, Jobless claims, Productivity, Inventories
- Global: Australia Trade Balance, Germany Factory Orders, Europe Retail Sales
- Central Banks:
- Interest Rate decision: Mexico
- Fed Balance Sheet
- Auctions: 4/8w
- Energy: EIA Natural Gas Inventories
- Earnings After-Market: ABX, AFL, ALTG, AHR, AIG, AMN, AMRZ, ARLO, ARNB, ARW, AORT, AGO, BARK, BLND, CABO, CTRE, CBL, CPK, CLPR, NET, CON, ED, CVSA, DV, DOCS, EFC, ESE, XZO, FIGS, G, GMED, GSBD, GRNT, GRND, GROV, GRDN, HASI, HG, HCI, KRMN, KWY, KGS, LION, MAIN, MTW, MBI, MSDL, MP, NGVC, NNI, NRDY, NOG, OSG, OFRM, ONTO, ONL, PBR, POST, RMAX, RGA, RSG, RMD, RLJ, RKT, RHP, SVV, SI, SARO, SG, TWLO, EGY, VHI, VTEX, WEAV, WHG, XPOF, YELP
- Friday -
- Earnings Pre-Market: AD, AMR, ASIX, ATMU, CTEV, CYD, DCH, ESNT, FLR, GLP, GTN, KRP, MBGL, OKLO, PK, PPL, SLVM, SPB, TDS, UAA, UE, VST
- Economic data
- US: Payrolls, Used car prices, Inflation Expectations
- Global: China Trade Balance, France unemployment, Trade Balance, Germany Trade Balance, Industrial Production, Mexico inflation, Canada unemployment
- Central Banks
- Fed Commercial Bank Balance Sheets
- Energy: Rig Count
- CFTC COT
- Earnings After-Market: None
Connect with NYSE
By submitting this form you hereby expressly grant permission to use the information included thereunder to contact you for the purposes of sending periodic updates about ICE and/or its affiliates. Certain indices mentioned above are administered by ICE Data Indices, LLC.
Your contact information will not be used for any purpose other than that for which your consent has been given. To learn more about our privacy policy, please click here.
© 2024 Intercontinental Exchange, Inc. All rights reserved. Intercontinental Exchange and ICE are trademarks of Intercontinental Exchange, Inc. or its affiliates. For more information regarding registered trademarks, limitations, restrictions, and other important information, please visit intercontinentalexchange.com/terms-of-use.